III. Viewing the Results
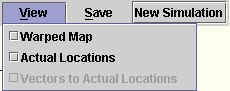
When you have finished answering all of the locations, and all of the questions. The toolbar will look like below:
![]()
1)To view results of the simulation left click
on the ![]() button.
button.
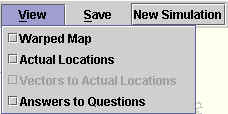
2) If you did not select any questions the drop down menu will look like below:
1) To view the warped map select the ![]()
checkbox from the View menu.
2) when you select Warped Map from the View Menu, the checkbox
will become checked ![]()
The border of the actual map will turn gray, and the Warped Map border will be red. Thw Warped Map shows how the outline of the Map would look if the locations were where you thought they were. This is your "Mental Map", or how you spatially relate where these locations are in actuality.
if you would like to hide the map, click on the ![]() checkbox in the View
Menu.
checkbox in the View
Menu.
When you click on the checkbox when it is already selected, it
will become de-selected,![]() and the warped map will disappear.
and the warped map will disappear.
B) Viewing the Actual Locations
1)To show where the actual locations are on the map (Compared
with where you entered them), left click on the ![]() checkbox in the View
Menu.
checkbox in the View
Menu.
2) When you select this option, the checkbox will become
selected![]()
And the Actual Locations will appear as black rectangles![]() , with labels beside
them.
, with labels beside
them.
...To hide the Actual Locations, click on the ![]() checkbox.
checkbox.
The checkbox will become un-checked ![]() , and the Actual locations, and labels
will disappear.
, and the Actual locations, and labels
will disappear.
C) Viewing Vectors from Your Locations to Actual Locations
Before you select any options from the View
Drop-Down menu, the Vectors to Actual Locations checkbox is not
enabled.![]()
If you have Actual Locations Selected in the
View Menu ![]() , The option to view Vectors will be
enabled
, The option to view Vectors will be
enabled
![]() .
.
Occasionally, it may be confusing to determine which Location
you entered corresponds to which Actual Location, to view a Line
between the Actual Location and the Location you entered, Select
the ![]() checkbox
from the View Menu.
checkbox
from the View Menu.
when you select this option, the checkbox will be selected ![]() .
.
Green lines will connect the Actual Locations (Which are black
rectangles![]() ) to the
Locations you entered (Which are green rectangles
) to the
Locations you entered (Which are green rectangles![]() ). This will help you
determine how far off your answers were.
). This will help you
determine how far off your answers were.
If you would like to make the vectors disappear, click on the ![]() checkbox in the View
Menu. The checkbox will become de-selected
checkbox in the View
Menu. The checkbox will become de-selected ![]() , and the Green vector
lines will disappear.
, and the Green vector
lines will disappear.
If, at the begining of the Simulation, you chose Questions for the simulation, when the simulation is completed the View Menu will look similar to the one below:
1) If you would like to see how close your
answers were to the actual answers click on the ![]() checkbox.
checkbox.
2) When you select this option, the checkbox
will become selected.![]()
... a new Window will appear with a table on it. This table will look different depending on which, and how many questions you answered, and also how many locations you were asked. Generally it will look like below:
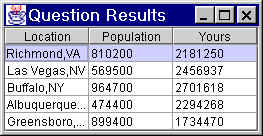
The First Column will allways contain the Location, and the Title of the second column will be the name of the Question (in the Above example it is "Population"), and below the name are the actual answers to this Question for the Location on any row. The third column titled "Yours" is the answer you gave on this question.
If you would like to hide the Question Results
window, you can click on the ![]() in the upper right hand corner of the window, or go
through the View Menu and deselect the
in the upper right hand corner of the window, or go
through the View Menu and deselect the ![]() checkbox.
checkbox.